Deploying Elixir: Package Problems

{% youtube HBncLmsogdA %}
Transcript of Video Below:
How's it going, folks. And thanks for checking out my video on lessons learned deploying elixir. So in this video, I want to talk about a situation that occurred shortly after I deployed my first elixir Phoenix application. So the site I deployed is called stream closed captioner. And it is a solution to add closed captions to a Twitch stream, to zoom meeting, OBS via OBS web sockets. This Phoenix application relies on web sockets to send messages from the client over to the backend, and then that gets sent over to Twitch.

It is a fairly straightforward pipeline, nothing too sophisticated. There isn't really much in the way of CPU-intensive calculations or anything like that. All it does is a query for user information regarding what it should do in terms of authentication, user settings, additional filtering to happen for the text to speech.
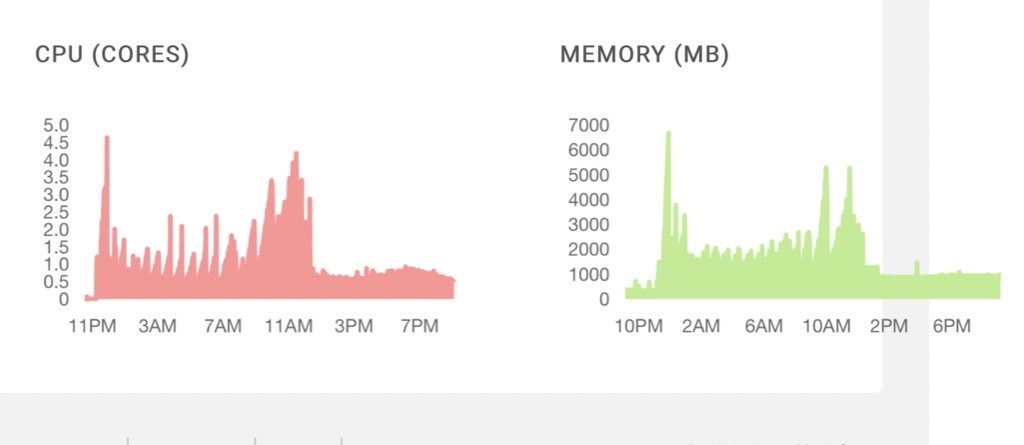
So I want to talk about a situation that happened shortly after deployment for this elixir application. For my hosting solution, I am using Gigalixir, and Gigalixir comes with a very nice and simple interface to see memory usage and CPU cores. This is the current implementation I have, and it's fairly straightforward. It is just two replicas and using one gigabyte of memory. After the deployment, I didn't see a very consistent graph. Instead, I saw something like this. So this is a screenshot of what was happening roughly two weeks ago; right after deployment, I had deployed the application at 11:00 PM, and I saw huge spikes in CPU usage.

This is at 11:00 PM, so there's not a lot of traffic. Again, there's not anything computationally heavy with the application. And I also saw huge spikes in memory. So much so that I saw out-of-memory errors, and that's not good. And Elixir is supposed to be fast, memory efficient.
This is my first elixir application. So I was like, what the heck is going on? This is fine, it's running, but it's not really fine. I'm in the middle of a fire. Things are running, but I'm hitting out of memory errors. I don't know what's going on. Locally, my Elixir application runs fine. It doesn't look like there's anything crazy going on, but there's obviously something very wrong. Something that doesn't fit with exactly what a Phoenix Elixir application is supposed to be. I'm not doing anything. Memory, CPU intensive. I'm not doing anything crazy with it. It is just a straightforward web socket application that's sending messages and posting API requests, nothing crazy. So I needed to dig in and figure out what the heck is going on because code-wise, everything looked straightforward. Luckily, I had instrumented my application to use new Relic.
So here's the new Relic dashboard, and New Relic is awesome because it provides a lot of great information about your application, the web requests, the throughput. One of the really awesome things about it also has, for elixir applications, a beam profiler so it can connect to the beam process and give you information about what is going on in the application. So I went into here, and I checked things out. I specifically looked at the processes, and nothing out of the ordinary was happening. So I went to the memory tab. So right now, this is the current application running in production.
As of today, today is June 6th. This is an example of fairly consistent memory usage for the application. The table sizes, kind of increasing, decreasing as traffic happens and as garbage collection occurs, but there is a pretty consistent, memory usage across the board. Now at the time where I was facing, out of memory errors, CPU spikes.

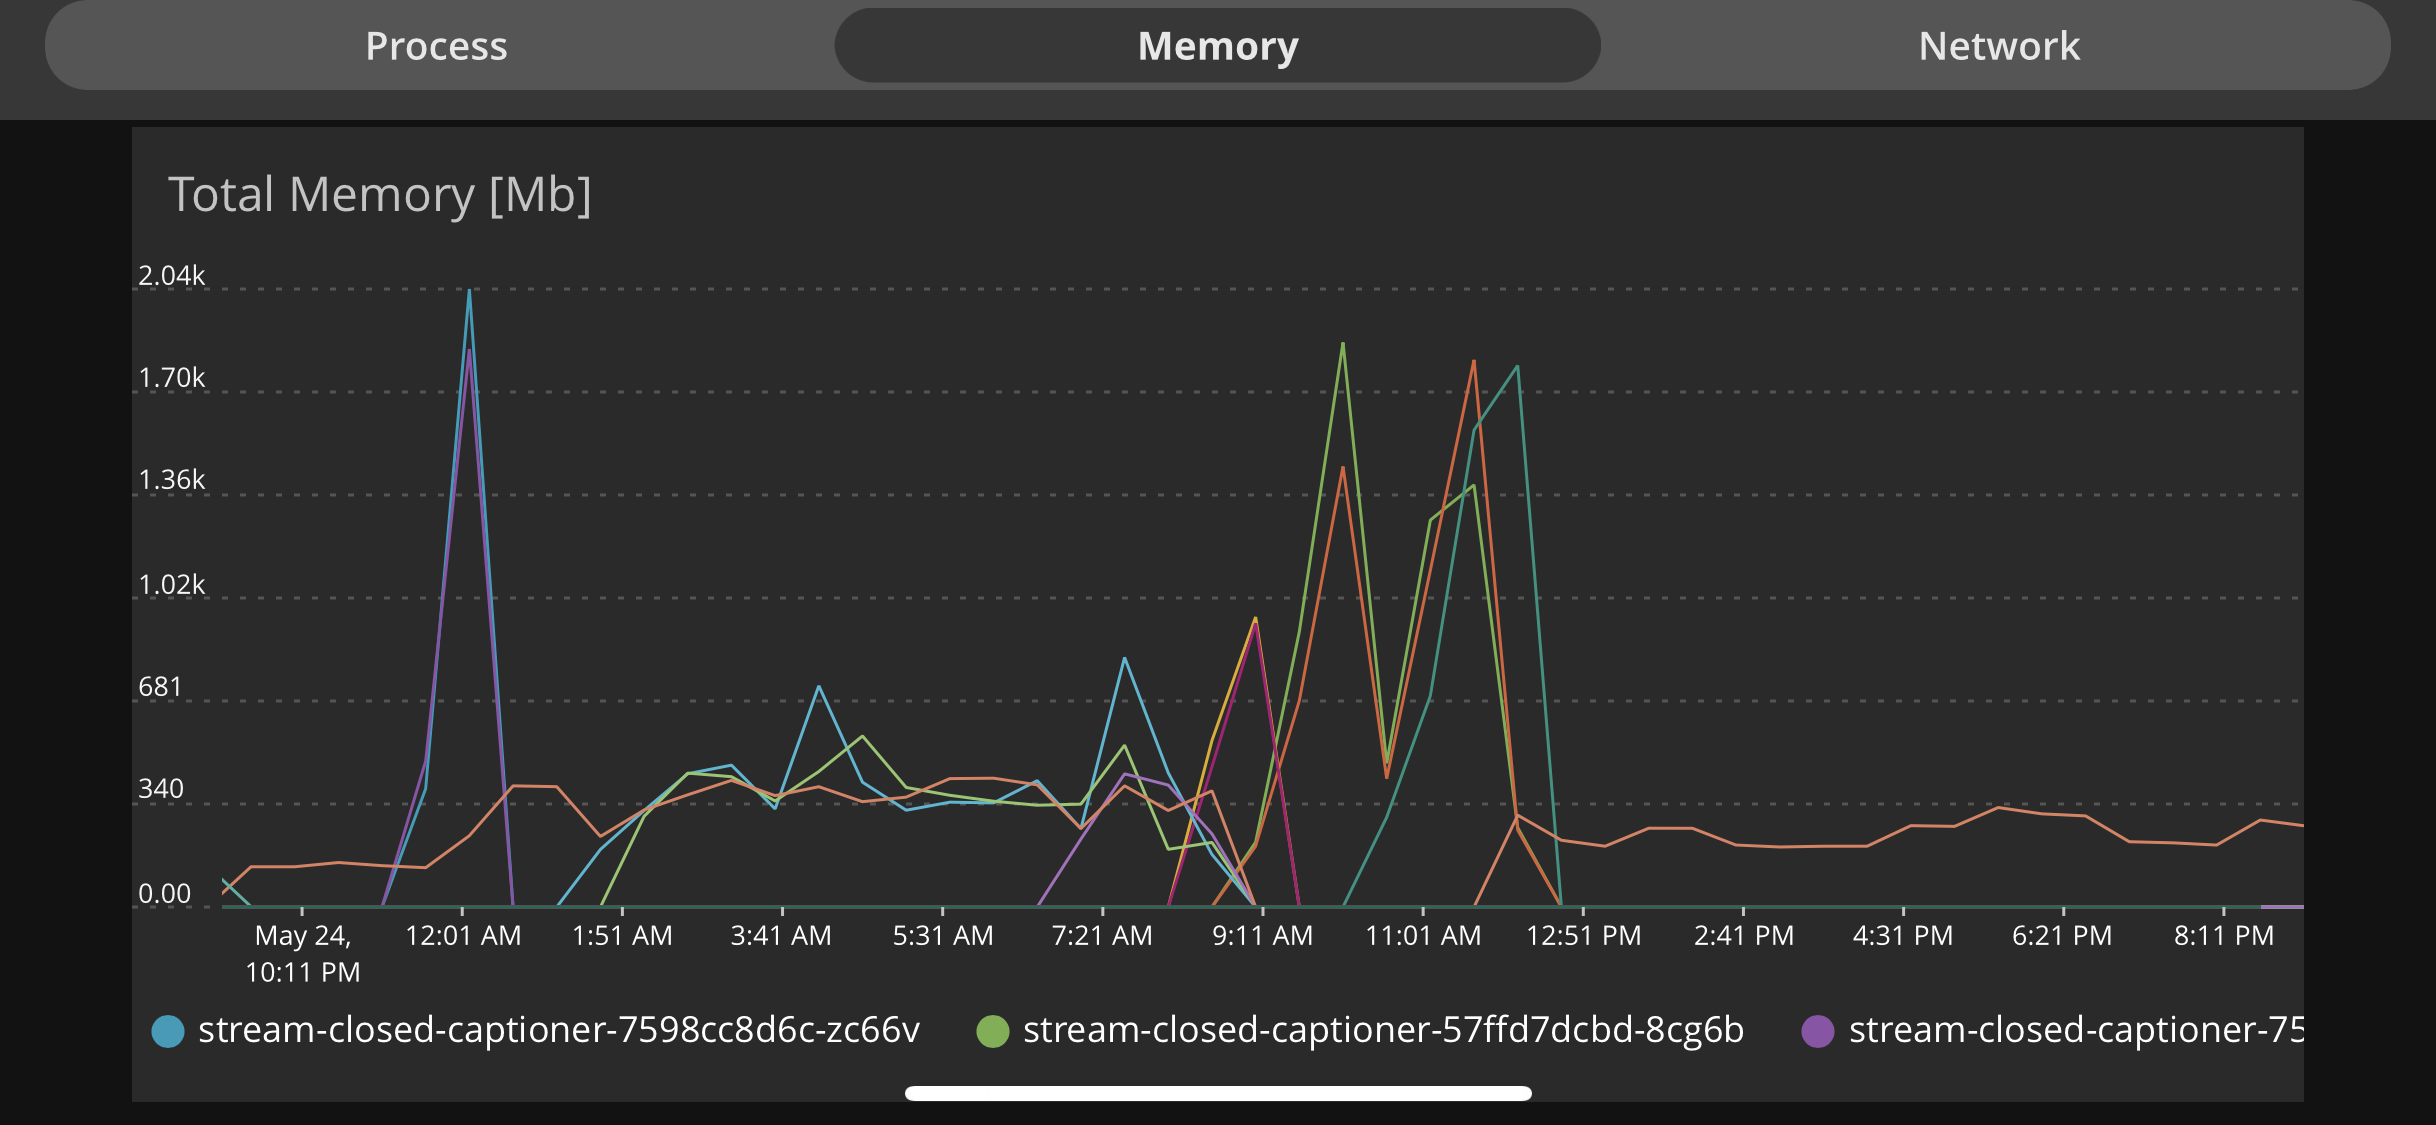
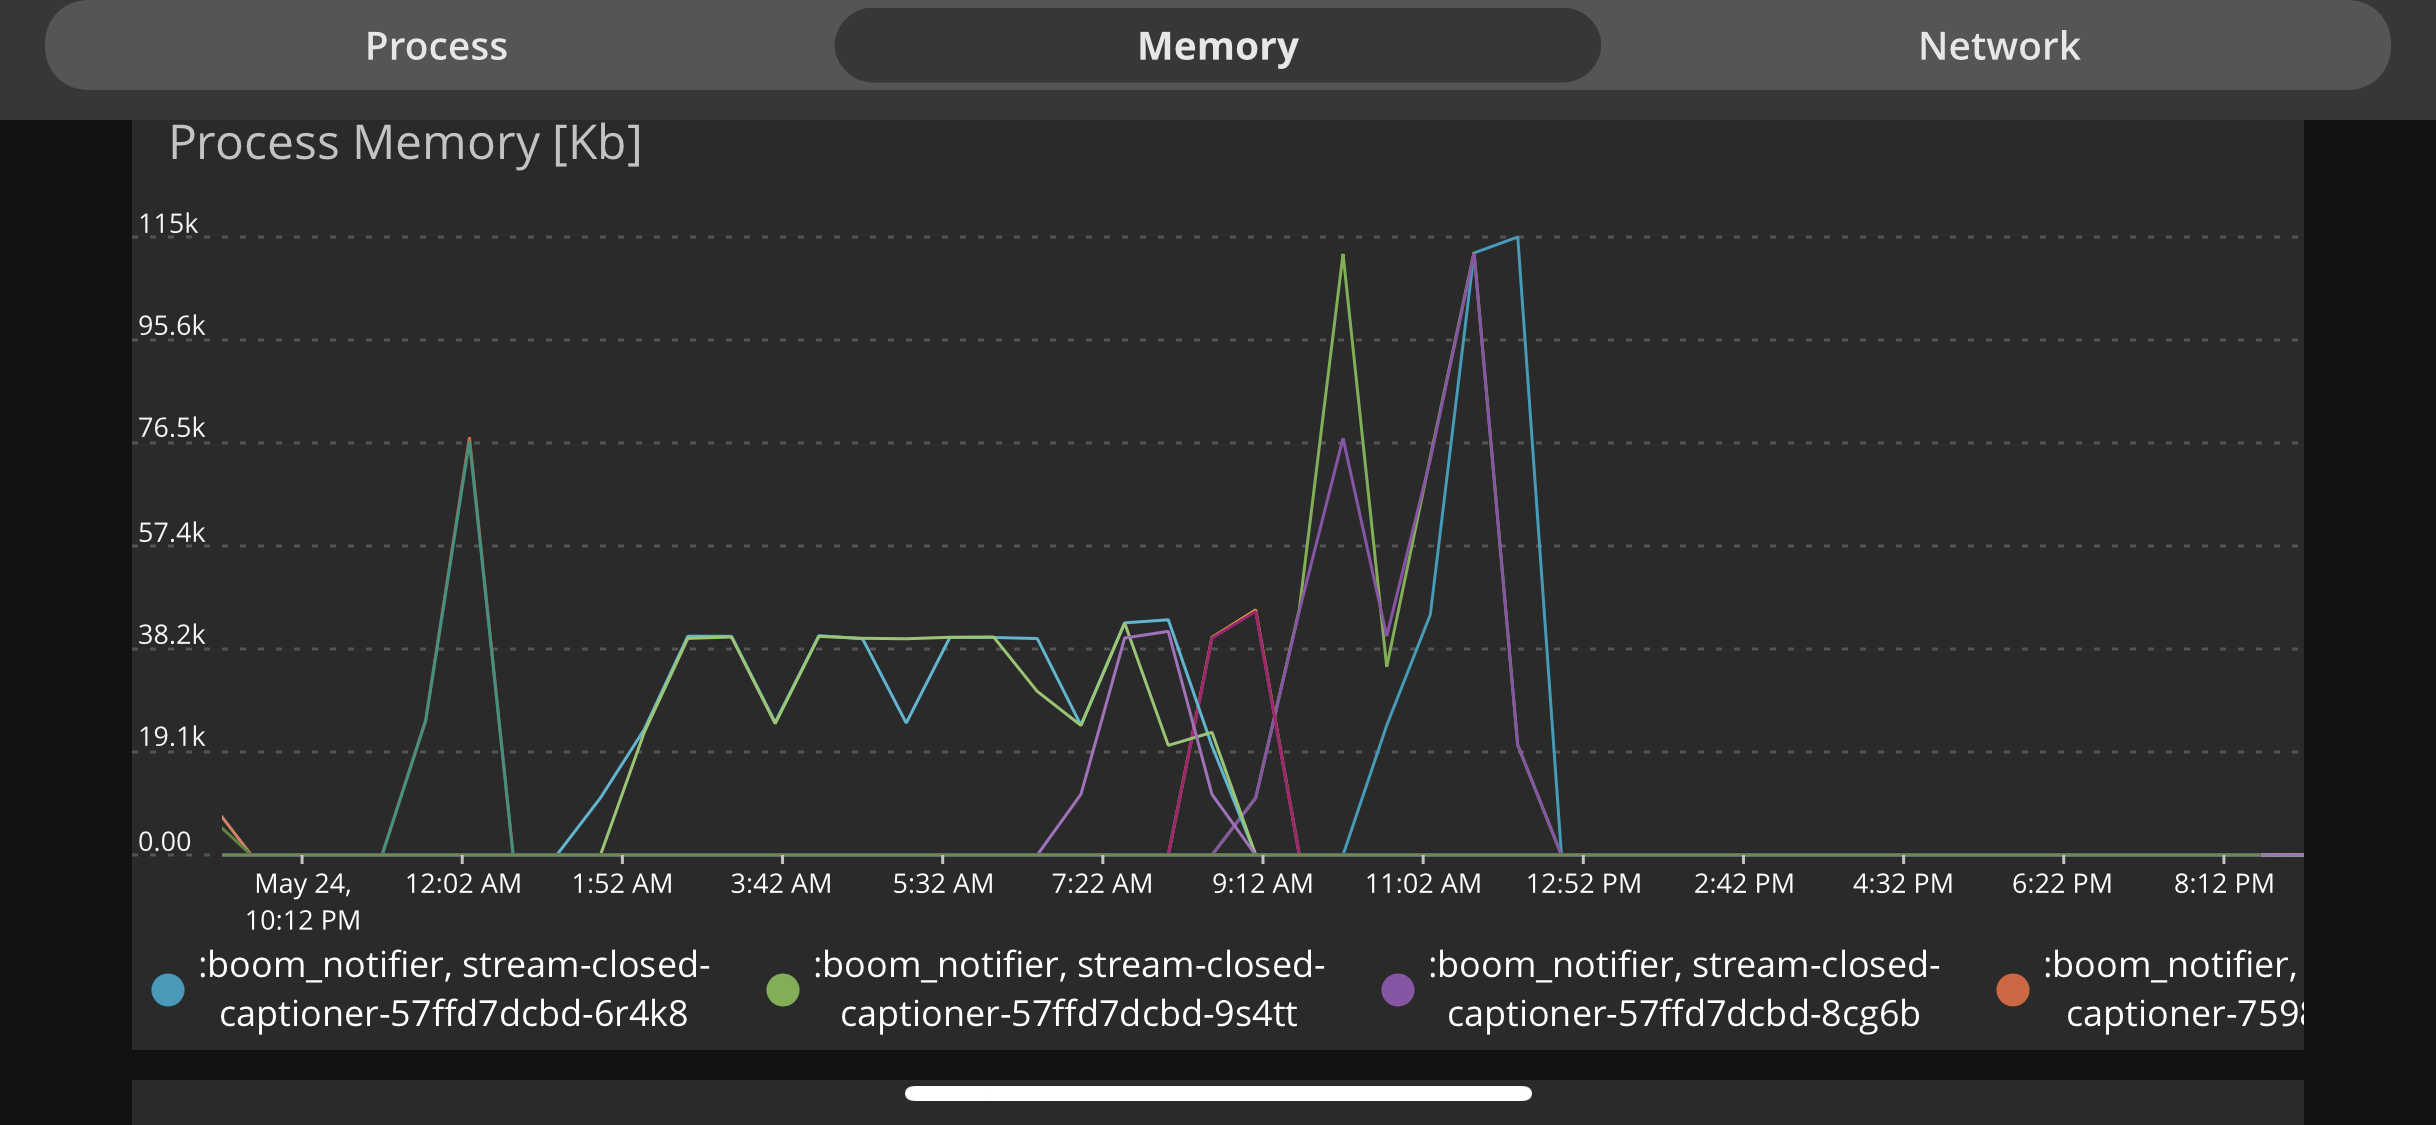
This is what I was saying. Unfortunately, with new Relic, the timeline to go back and look at memory and processes doesn't go back too far. It only goes about two weeks, but luckily I took some screenshots of what I saw, and I saw huge memory spikes. Ever since the deployment, you could see like here there are memory spikes here. There's a huge memory spike here, and it just wasn't making any sense what the heck is going on out of the total memory. So I kept on digging in, and I took a look at the process memory, and you can see what the process memory I was. I saw spikes again, huge, huge memory spikes there. But the cool thing about the process memory is that these lines represent the processes running in elixir, and everything's a process in elixir.

So I could see right here that boom notifier. This process is the thing that seems to be taking up lots of memory. It's always taking up memory. Regardless of whether I restarted the application, redeployed any changes it's, it's taking up memory. It's always spiking up pretty high. And I was like, Hmm.
Okay. Well, I know what boom notifier is, it's a notification package that I wanted to use to get emailed exceptions that happen in the application because it's a similar plugin that I was using in a Ruby on rails application I had been using. So I just wanted to receive emails whenever an exception happens, so I can quickly track those.
Here's the package itself, boom, notifier. And I followed all the guides. It was fairly straightforward to use and configure. But as we saw on this chart right here, it looks like boom notifier is showing some memory peaks. So okay, well, I don't need boom notifier because new Relic offers error tracking in case there are 500 errors, exceptions being thrown.
So I don't need boom notifier. So let me try and get rid of boom notifier. And see what happens. I had taken it out of the mix.exs, committed the changes, and deployed them. And so what happened. Now, if we go back to this graph over here and we see these spikes, we see a huge drop off right here at the end, this right here is after boom notifier was removed and the application was deployed. So I'm not trying to knock boom notifier or anything. It's a solid plugin for your application, but in my situation, it was causing some huge CPU and memory usage problems. And you can see right here that after I removed it, it went down significantly.
And now I was below 1.0 CPU usage. And also memory dropped down to a very, very consistent level.
Which was awesome. So after removing this package, I saw a significant gain and performance. And if we go back here, we had the spikes here and after. The deployment, removing boom notifier. You see a very consistent level of memory here and the same thing over here, the process memory drops down by a lot.
So what is the lesson that I learned? Right out of the gate with Elixir and packages. It's to be careful, be very careful of what you put into your application because if you don't need it, don't use it.
So after that, now I have a very consistent graph of memory usage across the board and my application no longer runs out of memory and no longer has drastic CPU spikes. It is very consistent, very efficient, and it's very much what an elixir application should be. If there's anything I want you to take away from this video, it's that just be careful with your packages and use the tools necessary to keep track of your application, to see what the performance is, what the memory usage is. So you can identify things that could be hindrances, could be bottlenecks for your application in production. I got lucky that I had set up New Relic ahead of time.
I know there's another tooling that you can use for elixir, but New Relic was the easiest thing for me since I am fairly new to Elixir itself and running it in production.
So hopefully you learn something new from this, and I will see you in the next video. Thanks, everyone.


